Property Philly
Authors: Sylvia Lam, Wei Jing Ang, Yao Han Xu, James To, Ryan Swett
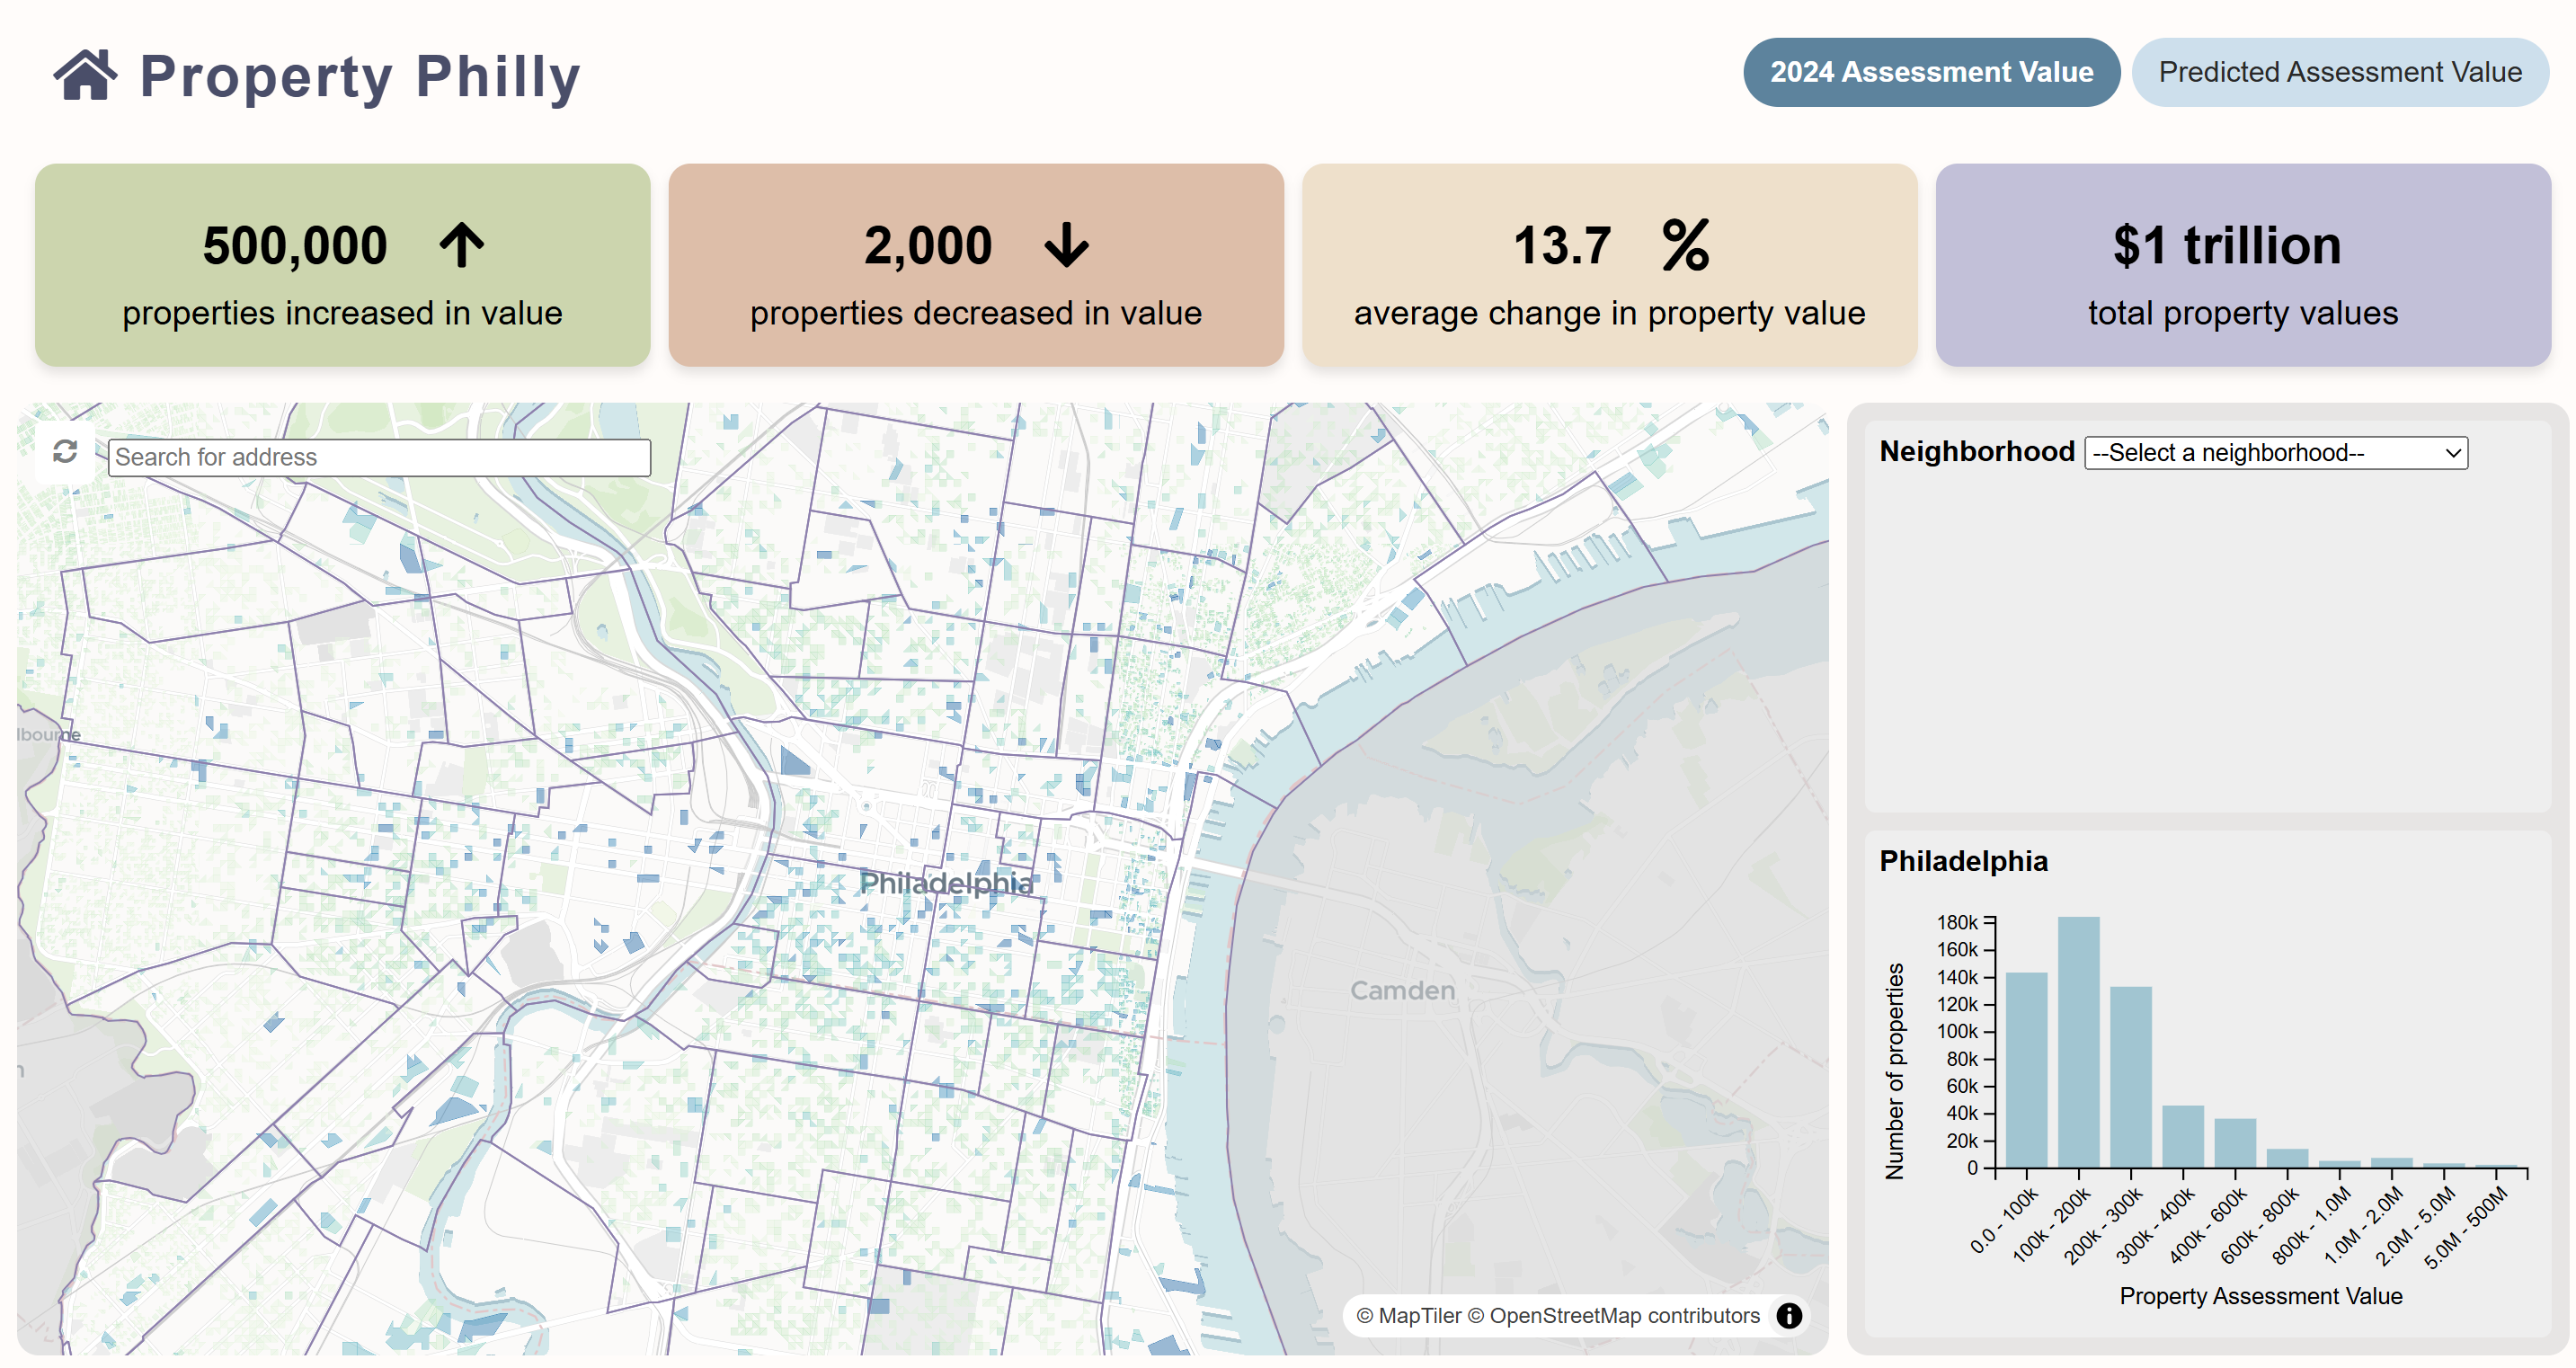
This project aimed to develop an interactive, cloud-native dashboard to assist property owners, assessors, and urban analysts in visualizing and understanding predicted property values across Philadelphia. The platform enables users to explore historical price trends and forecasted valuations at the parcel, neighborhood, and citywide scale.
The system is powered by a fully automated data pipeline built on Google Cloud Platform. This architecture allows for seamless ingestion, transformation, and storage of publicly available property datasets. The cloud infrastructure includes the following components:
- Google Cloud Functions: Executes scheduled Python scripts for data extraction and preprocessing.
- Google Cloud Workflows: Coordinates the sequence of pipeline tasks using an event-driven model.
- BigQuery: Serves as the central data warehouse where spatial and tabular queries are performed using SQL.
- Cloud Storage: Hosts vector tiles and GeoJSON outputs that are served to the web interface.
The predictive engine is based on a Random Forest regression model. Processed results are exposed through a custom API that supports the visualization of both spatial data and statistical summaries.
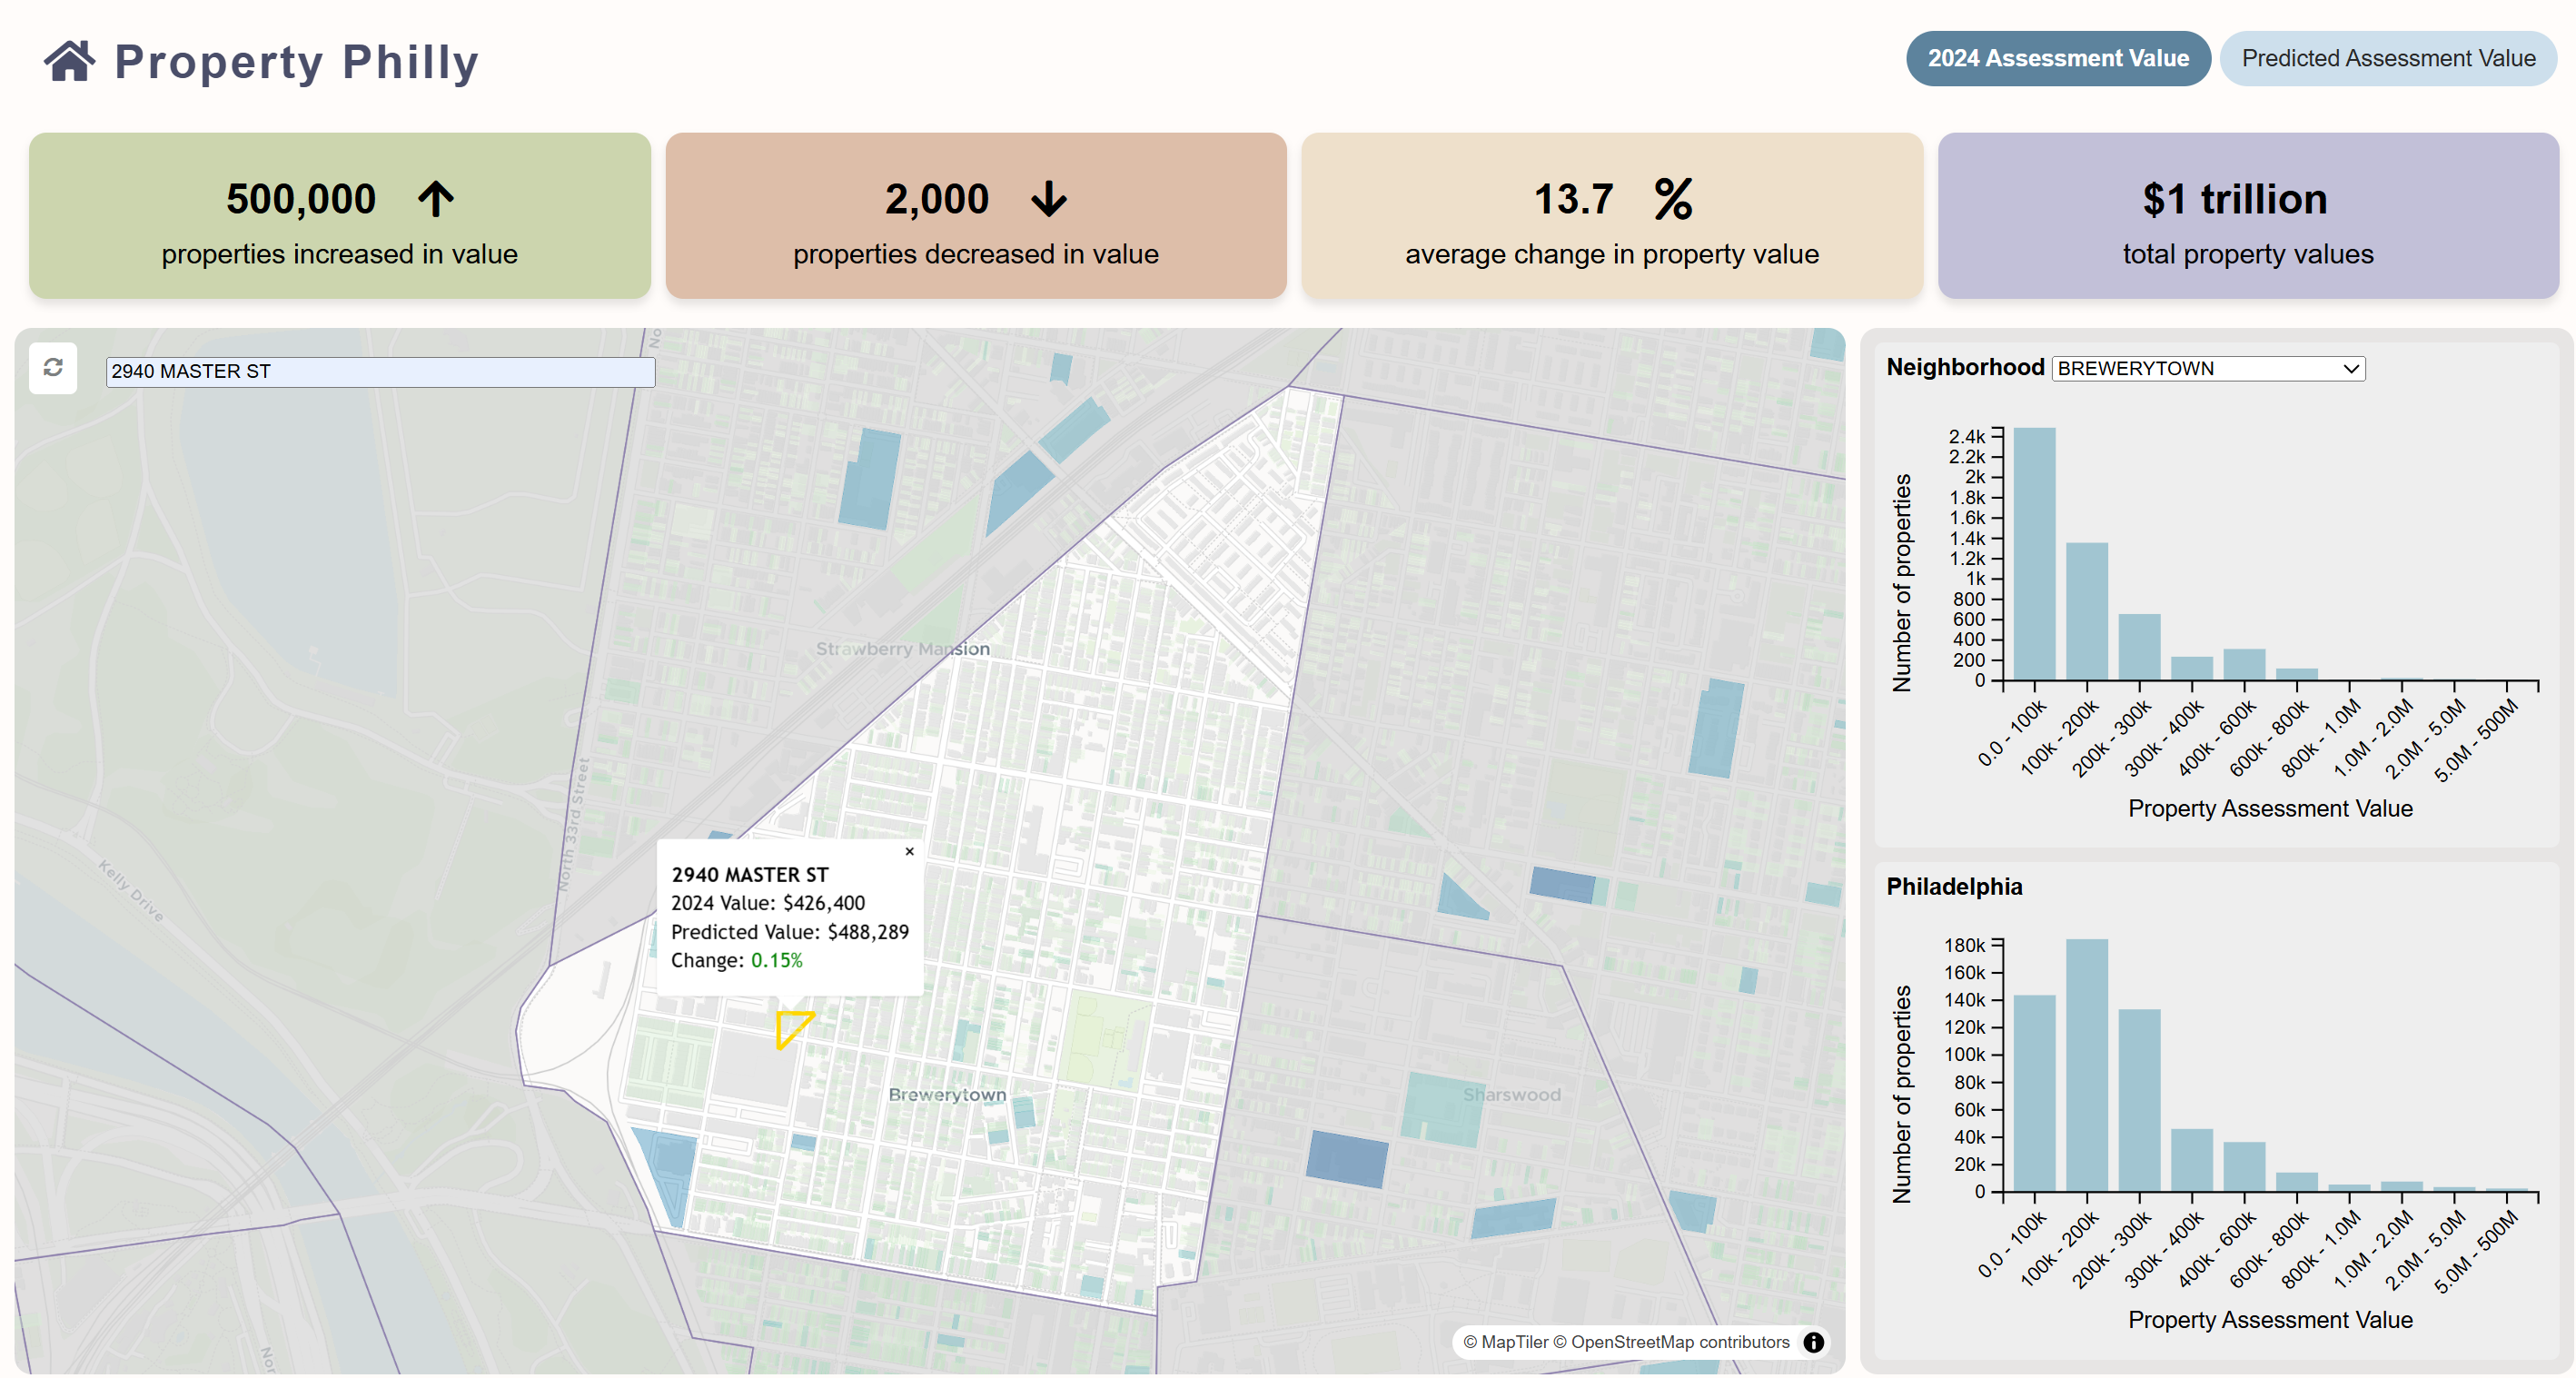
Users could key in an address of a property they were interested in to gain more insights on the property price changes of that particular property that is shown in the pop-up. The dashboard also automatically zooms in on the neighborhood that the selected property is located in to display the distribution of property prices in that neighborhood on the graphs. In this way, the users are able to get a grasp of the property price of a specific property, at the neighborhood level, and at the city level to better understand any spatial patterns of current property prices and predicted changes in property prices.
The web interface is built using vanilla JavaScript. Spatial data layers are rendered using Mapbox vector tiles. The interface communicates with the backend through asynchronous API calls, which serve JSON responses to populate charts and map layers in real time.
Key functionality includes:
- Address Search: Users can input a specific address to retrieve detailed property information.
- Intelligent Map Navigation: Upon address selection, the dashboard automatically zooms into the property's neighborhood and displays relevant price distributions and bar graphs.
- Multi-Scale Visualization: Users can observe price patterns at various scales, allowing for deeper insights into localized trends and broader market behavior.
The live dashboard can be accessed using the link below. It showcases the integration of spatial data science, cloud infrastructure, and machine learning for public-facing property analytics:
Philadelphia Property Valuation Dashboard
The github repository with a more detailed documentation for the methadology of our project can be found here.